Hanan Farahdel
5 سال پیش
توسط Hanan Farahdel
مطرح شد
خروجی نمودارchart چارت در لاراول اکسل laravel-excel
با سلام خدمت دوستان
نیاز دارم که در خروجی فایل اکسل همراه داده های نمودار هم داشته باشم و برای اینکار از پکیج laravel-excel استفاده میکنم که طبق مستندات سایت https://docs.laravel-excel.com/ پیش رفتم که کدم به صورت زیر در اومد:
<?php

namespace App\Exports;

use Illuminate\Contracts\Support\Responsable;
use Maatwebsite\Excel\Concerns\Exportable;
use Maatwebsite\Excel\Concerns\FromCollection;
use Maatwebsite\Excel\Concerns\ShouldAutoSize;
use Maatwebsite\Excel\Concerns\WithEvents;
use Maatwebsite\Excel\Events\AfterSheet;
use PhpOffice\PhpSpreadsheet\Chart\Chart;
use PhpOffice\PhpSpreadsheet\Chart\Title;
use PhpOffice\PhpSpreadsheet\Chart\Legend;
use Maatwebsite\Excel\Concerns\WithCharts;
use PhpOffice\PhpSpreadsheet\Chart\PlotArea;
use PhpOffice\PhpSpreadsheet\Chart\DataSeries;
use PhpOffice\PhpSpreadsheet\Chart\DataSeriesValues;

class ChartExport implements  FromCollection, WithCharts, ShouldAutoSize,Responsable
{

    use Exportable;
    private $fileName = "report.xlsx";

    public function collection()
    {
        return collect([
            ['', 'Transport', 'Restaurant', 'Gym'],
            ['Jan', 12, 15, 21],
            ['Feb', 56, 73, 86],
            ['Mar', 52, 61, 69],
            ['Apr', 30, 32, 0],
            ['May', 40, 23, 10],
            ['Jun', 76, 2, 93]
        ]);
    }

    public function charts()
    {
        /** @1 */
    // Set the Labels for each data series we want to plot
        $dataSeriesLabels = [
            new DataSeriesValues(DataSeriesValues::DATASERIES_TYPE_STRING, 'Worksheet!$B$1', null, 1), // Transport
            new DataSeriesValues(DataSeriesValues::DATASERIES_TYPE_STRING, 'Worksheet!$C$1', null, 1), // Restaurant
            new DataSeriesValues(DataSeriesValues::DATASERIES_TYPE_STRING, 'Worksheet!$D$1', null, 1), // Gym
        ];

        /** @2 */
    // Set the X-Axis Labels
        $xAxisTickValues = [
            new DataSeriesValues(DataSeriesValues::DATASERIES_TYPE_STRING, 'Worksheet!$A$2:$A$7', null, 6), // Jan to Jun
        ];

        /** @3 */
    // Set the Data values for each data series we want to plot
        $dataSeriesValues = [
            new DataSeriesValues(DataSeriesValues::DATASERIES_TYPE_NUMBER, 'Worksheet!$B$2:$B$7', null, 6),
            new DataSeriesValues(DataSeriesValues::DATASERIES_TYPE_NUMBER, 'Worksheet!$C$2:$C$7', null, 6),
            new DataSeriesValues(DataSeriesValues::DATASERIES_TYPE_NUMBER, 'Worksheet!$D$2:$D$7', null, 6),
        ];

        /** @4 */
    // Build the dataseries
        $series = new DataSeries(
            DataSeries::TYPE_BARCHART, // plotType
            DataSeries::GROUPING_STANDARD, // plotGrouping
            [0, 1, 2], // plotOrder
            $dataSeriesLabels, // plotLabel
            $xAxisTickValues, // plotCategory
            $dataSeriesValues // plotValues
        );

    // Set the series in the plot area
        $plotArea = new PlotArea(null, [$series]);

        /** @5 */
    // Set the chart legend
        $legend = new Legend(Legend::POSITION_TOP);

        /** @6 */
        $title = new Title('First Half Year Costs Overview');
        $yAxisLabel = new Title('Cost');
        $xAxisLabel = new Title('Month');

        /** @7 */
    // Create the chart
        $chart = new Chart(
            'chart', // name
            $title, // title
            $legend, // legend
            $plotArea, // plotArea
            true, // plotVisibleOnly
            0, // displayBlanksAs
            $xAxisLabel, // xAxisLabel
            $yAxisLabel // yAxisLabel
        );

        /** @8 */
    // Set the position where the chart should appear in the worksheet
        $chart->setTopLeftPosition('A9');
        $chart->setBottomRightPosition('G22');

        return $chart;
    }

//    public function export()
//    {
//        return (new ChartExport())->download('reports.xlsx');
//    }

}
بعد از دانلود فایل و باز کردنش خطای زیر نمایش داده میشه

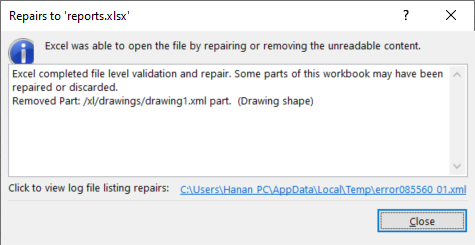
اگر yes رو بزنم خطای زیر نمایش داده میشه و اگر no رو بزنم فایل باز نمیشه

بنظرتون مشکل از کجاست ؟؟
ممنون میشم دوستانی که در این زمینه کار کردن راهنمایی کنن
متشکرم
گزینش سوالات
گفت و گو های مرتبط
دسته بندی سوالات
تگهای محبوب
ثبت پرسش جدید
به همدیگه کمک کنیم
به Hanan Farahdel کمک کنید تا مشکل خودش را حل کند؛ اینطور میتوانیم با هم پیشرفت کنیم.
